
Forum Replies Created
-
AuthorPosts
-
Dear Ross
Can you please send (email) some sample data that can replicate the issue you are having. I think the specific issue might be an artifact of your dataset.Dear Ross
To replicate the issue you’re facing, I have created a dummy dataset and performed a nested regression. In the code and output below, I noticed that the base category includes extra wording (“Fund Strategies, Categories from Raw Data”), which I will fix. If you are experiencing a different issue, please either use my dataset or share a sample of your own so I can better understand the problem.
[code]
*—————————————–
* Step 1: Create dummy data
*—————————————–
clear
set seed 1234
set obs 10* Create a string variable Fund_Strategy_EV_Size
gen Fund_Strategy_EV_Size = “”* Populate dummy data with various cases and missing values:
replace Fund_Strategy_EV_Size = “micro cap” in 1
replace Fund_Strategy_EV_Size = “small cap” in 2
replace Fund_Strategy_EV_Size = “lower mid cap” in 3
replace Fund_Strategy_EV_Size = “mid cap” in 4
replace Fund_Strategy_EV_Size = “large cap” in 5
replace Fund_Strategy_EV_Size = “MICRO CAP” in 6 // test case: uppercase letters
replace Fund_Strategy_EV_Size = “sMaLL CaP” in 7 // test case: mixed case
* Observations 8 and 10 remain empty (i.e., missing)
replace Fund_Strategy_EV_Size = “mid cap” in 9*—————————————–
* Step 2: Create and assign Fund_Strategy based on EV_Size
*—————————————–
gen Fund_Strategy = “” // Initialize the new variablereplace Fund_Strategy = “[01] Micro Cap” if trim(lower(Fund_Strategy_EV_Size)) == “micro cap”
replace Fund_Strategy = “[02] Small Cap” if trim(lower(Fund_Strategy_EV_Size)) == “small cap”
replace Fund_Strategy = “[03] Lower Mid Cap” if trim(lower(Fund_Strategy_EV_Size)) == “lower mid cap”
replace Fund_Strategy = “[04] Mid Cap” if trim(lower(Fund_Strategy_EV_Size)) == “mid cap”
replace Fund_Strategy = “[05] Large Cap” if trim(lower(Fund_Strategy_EV_Size)) == “large cap”* For observations with a missing Fund_Strategy_EV_Size, mark as Unknown
replace Fund_Strategy = “[99] Unknown” if missing(Fund_Strategy_EV_Size)*—————————————–
* Step 3: Encode Fund_Strategy into a numeric variable
*—————————————–
encode Fund_Strategy, generate(cat_Fund_Strategy) label(cat_Fund_Strategy)
label variable cat_Fund_Strategy “Fund Strategy Categories, From Raw Data”
expand 100gen returns = uniform()
gen size = uniform()
gen expense = returns + uniform()/10
gen cat_Fund_Status = mod(_n,4)
label define fundstatus 1 “Active” 2 “Passive” 3 “Divestment” 0 “Unknown”, modify
label values cat_Fund_Status fundstatusglobal x_fact_controls ///
ib(2).cat_Fund_Strategy /// // Base: [02] Small Cap
ib(3).cat_Fund_Status /// // Base: [03] Divestmentasdocx reg returns size expense $x_fact_controls, replace label tzok fs(9) abb(.) nest
[/code]Table: Regression results(1) Variables returns size -0.001 (0.003) expense 0.990*** (0.003) [01] Micro Cap 0.002 (0.003) Fund Strategy Categories, From Raw Data : base [02] Small Cap [03] Lower Mid Cap 0.001 (0.003) [04] Mid Cap 0.000 (0.003) [05] Large Cap -0.003 (0.003) [99] Unknown 0.003 (0.003) Unknown -0.001 (0.003) Active -0.002 (0.003) Passive 0.001 (0.003) : base Divestment Intercept -0.044*** (0.003) Observations 1000.000 R2 0.991 Notes: Standard errors are in parentheses. *** p<.01, ** p<.05, * p<.1 in reply to: sem output to Excel – asdocx estat teffects #18566You can send the
teffectsoutput to Excel by setting the output type to Excel before running theestat teffectsoption with asdocx. Here is an example:[code]
asdocx setfile, save(MyTable.xlsx)webuse sem_sm1, clear
sem (r_occasp <- f_occasp r_intel r_ses f_ses) ///
(f_occasp <- r_occasp f_intel f_ses r_ses), ///
cov(e.r_occasp*e.f_occasp)asdocx estat teffects
[/code]2. asdocx creates
teffectsoutput from the stored matrix returned by Stata. This matrix does not contain confidence intervals. If confidence intervals are required, they must be calculated and appended to the matrix before being written to a file using asdocxin reply to: Problem with decimals in flexmat #18530Hello Ana Diaz,
You have mentioned a problem with decimal points in the subject, but in the text, you have mentioned that you have problems with brackets and stars.
In the following code, I have processed the macro to format the values as %9.3f.flexmatcan format single values, but if the values involve text or symbols, you have to format the value for decimal points before combining it with other items, such as *, -, or +. I have also shown how to add brackets and *.
[code]
capture program drop balance_fe
program define balance_fe
version 15.1syntax varlist [if] [in], Doc(name)
asdocx setfile, save(`doc’)
flexmat reset
flexmat addrow, data(\i, T=0 , \i, \i, T=1, \i,\i,\i) row(1) col(1)
flexmat addrow, data(Var, T , C , Diff, T , C , Diff) row(2) col(1)
flexmat addrow, data(\i, (mean) , (mean) , \i , (mean) , (mean) , \i) row(3) col(1)local i = 4
local j = 5
* Loop through each variable and run the regression separately for entrada == 0 and entrada == 1
foreach var of varlist `varlist’ {* Regression for entrada == 0
reg `var’ tratados PcD_siempre_req_ayuda i.localidad_cuidador if encuesta == 0* Capture the coefficient for TRATADOS (this is the adjusted difference)
local coef_0 = _b[tratados]local se_0 = _se[tratados]
* decimal points
loc coef_0 : dis %9.3f = `coef_0′
loc se_0 : dis %9.3f = `se_0′
local p0 =2*ttail(e(df_r),abs(`coef_0′ / `se_0′))if `p0′<=0.01 {
local star0 “***”
}
else if `p0′<=0.05{
local star0 “**”
}
else if `p0′<=0.1{
local star0 “*”
}
else {
local star0 ” ”
}
local star0 `star0′* Calculate the mean for treatment and control groups from the regression for entrada == 0
local intercept_0 = _b[_cons]
local mean_treated_0 = `intercept_0′ + `coef_0′
local mean_control_0 = `intercept_0′* decimal points
loc intercept_0 : dis %9.3f = `intercept_0′
loc mean_treated_0 : dis %9.3f = `mean_treated_0′
loc mean_control_0 : dis %9.3f = `mean_control_0′* Regression for entrada == 1
reg `var’ tratados PcD_siempre_req_ayuda i.localidad_cuidador if encuesta == 1* Capture the coefficient for TRATADOS (this is the adjusted difference)
local coef_1 = _b[tratados]
local se_1 = _se[tratados]
local p1 =2*ttail(e(df_r),abs(`coef_1′ / `se_1′))* decimal points
loc coef_1 : dis %9.3f = `coef_1′
loc se_1 : dis %9.3f = `se_1′
loc p1 : dis %9.4f = `p1′if `p1′<=0.01 {
local star1 “***”
}
else if `p1′<=0.05{
local star1 “**”
}
else if `p1′<=0.1{
local star1 “*”
}
else {
local star1 ” ”
}
local star1 `star1′* Calculate the mean for treatment and control groups from the regression for entrada == 1
local intercept_1 = _b[_cons]
local mean_treated_1 = `intercept_1′ + `coef_1′
local mean_control_1 = `intercept_1′* decimal points
loc intercept_1 : dis %9.3f = `intercept_1′
loc mean_treated_1 : dis %9.3f = `mean_treated_1′
loc mean_control_1 : dis %9.3f = `mean_control_1′* Create a table with asdoc, combining results for entrada == 0 and entrada == 1
flexmat addrow, data(`var’, `mean_treated_0′, `mean_control_0′, `coef_0′ `star0′, `mean_treated_1′, `mean_control_1′, `coef_1′ \i `star1′) row(`i’) col(1) dec(3)
flexmat addrow, data(\i, \i, \i, [`se_0”], \i, \i, [`se_1′] ) row(`j’) col(1) dec(3)local i = `i’+2
local j = `j’+2
}
asdocx export
endglobal attributes_cuid female_cuidador
balance_fe $attributes_cuid, doc(opinion)[/code]
in reply to: Reg2 Template? #18478Yes, you understood it correctly.
in reply to: asdocx + Histogram #18463Dear Kevin
Thanks for your feedback. The error message indicates that it is caused by the Mata setting being set tomatastrict on. I have fixed the issue. You may update asdocx withasdocx_update.in reply to: Reg2 Template? #18459Dear Kevin,
Thank you for your interest in the
reg2template. Thereg2template treats the first variable as the independent variable, followed by a list of dependent variables. This is indeed documented on thereg2page.It’s also important to note that Stata does not allow factor variables in the dependent variable. This is a limitation of the software and not the template itself. The
reg2template is designed to work within these constraints.I hope this clarifies your query. If you have any more questions or need further assistance, feel free to ask.
in reply to: Reg2 Template? #18413Dear Kevin
Thanks for the follow up and the initial query. I have now added a page for reg2, visit it to get more details about the template.in reply to: oneway and rank sum unknow sub-command #18370Dear Theresa L Harm
I have now addedonewayto asdocx. Here is a working example. Do not forget to update asdocx before trying the example.
[code]* asdocx_update
asdocx_update
⠀
* Load example data
webuse apple
⠀
* asdocx with oneway
asdocx oneway weight treatment, replace
⠀Analysis of variance
0 |1 2 3 4 5 6
—-+———————————————————————————————-
1 |Source SS df MS F Prob > F
—-+———————————————————————————————-
2 |Between groups 5295.544 3 1765.181 21.457 0.001
3 |Within groups 493.592 6 82.265
—————————————————————————————————
Bartlett’s equal-variances test: Chi²(3) = 1.390(3) Prob>Chi² = 0.7079
⠀
[/code]in reply to: Export table from pstest of psmatch2 #18369Dear Yang,
I’m pleased to inform you that support for
pstesthas been added to asdocx. You can now exportpstestresults using asdocx to create well-formatted tables. For examples and syntax, please visit our this page https://asdocx.com/export-pstest-table-from-stata-to-word-excel-latex-with-asdocx/.Dear Kevin
Visit this thread for groups https://asdocx.com/forums/topic/asdocx-groups/in reply to: asdoc fails to report the p-values and chi-square #18333This feature was added to asdocx (https://fintechprofessor.com/asdocx/), see this example
[code]sysuse nlsw88
asdocx tab age race, chi replace[/code]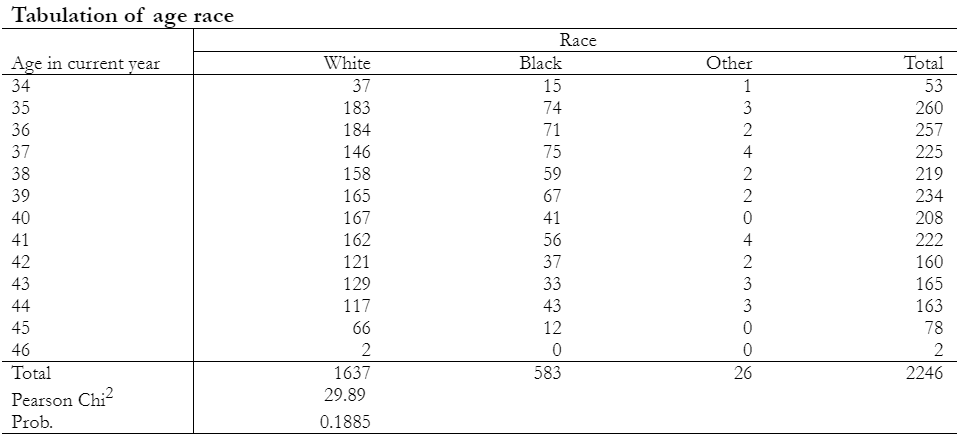
Hello David
I see that you are using by() option with template(table1). As discussed here https://asdocx.com/documentations/creating-and-working-with-asdocx-template-files/table1-template-for-baseline-characteristics-of-patients-asdocx/, table1 template has a different syntax. If have a treatment variable, that must be written first, followed by other variables. Therefore, there is no by() option in template1. Here is the correct syntax.[code]asdocx tab pus_cord_total28 i.mateduc_2cat i.wealth_tertile i.number_of_ANC ///
i.bwt_3cat i.Parity_cat i.pateduc_2cat i.mothers_age_category i.Place_Birth2 ///
i.married i.rur i.mode_birth i.childsex_2, factor(N %) by(pus_cord_total28) ///
continuous(mean sd) template(table1) table_layout(autofit) save(omphalitis.xlsx) ///
replace dec(2) dect(2)[/code]Before using the above, do update asdocx with
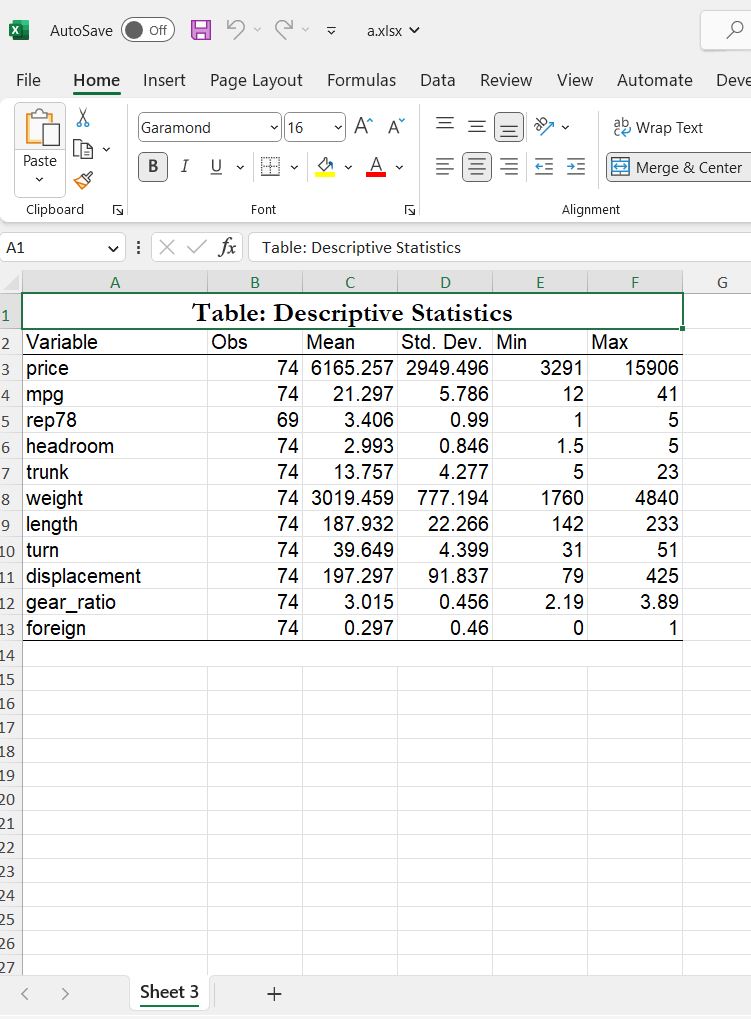
asdocx_update.I have fixed the issue with fonts and sheet name. Please note that you can specify sheet name using the option `sheet()’. See the following example:
[code]asdocx_updatesysuse auto
asdocx sum, save(a.xlsx) replace sheet(Sheet 3) font(Arial)
[/code]
Hello Kevin
I have updated thetable1template. I hope the update fixes the errors you have mentioned. Here is a working example.
[code]
asdocx_update* Use example data
use http://fintechprofessor.com/asdocxAddins/table1.dta, clear* Export table1 with no treatment effect.
asdocx tab immigrant bone_arthritis bone_backspin bone_backother bone_neck ///
bone_fibro bone_lupus, template(table1) notreatment replaceTable 1: Demographics
0 |1 2
—-+—————————————————-
1 |Variables Total (1000)
—-+—————————————————-
2 |immigrant
3 | Non-Immigrant 670 (86.118%)
4 | Immigrant 108 (13.882%)
5 |Arthritis
6 | No arthritis 165 (17.387%)
7 | Arthritis 784 (82.613%)
8 |Back pain due to s~s
9 | No back pain due ~n 918 (96.733%)
10 | Back pain due to ~i 31 (3.267%)
11 |Back pain due to o~s
12 | Back pain due to ~s 1000 (100.000%)
13 |Neck pain
14 | No neck pain 803 (84.615%)
15 | Neck pain 146 (15.385%)
16 |Fibromyalgia
17 | No fibromyalgia 923 (97.260%)
18 | Fibromyalgia 26 (2.740%)
19 |Lupus
20 | No lupus 944 (99.473%)
21 | Lupus 5 (0.527%)
———————————————————-[/code]
With regards to the inclusion of new statistics, I’ve taken note of your recommendations and will take them into account as soon as my schedule allows.
-
AuthorPosts