
Forum Replies Created
-
AuthorPosts
-
in reply to: “Tab” Conformability Error #17356
When a table had a single column, the Excel routine will throw the mentioned error. This has been fixed. You may update asdocx.
in reply to: “Tab” Conformability Error #17339I agree that asdocx should report a proper error message, instead of the function’s conformability error. I shall work on it and update it. Having said that, you can overcome the no observation error with the
captureprefix. Therefore, if there is any such error, the code will run without throwing the said error and breaking the execution of the rest of the code.sysuse auto , clear capture asdocx tab make foreign if make=="Subaru" & foreign==0
in reply to: shwing t values in the output with pred(t) #17333I have updated asdocx. The new version has a fix for the mentioned issue. You may update asdocx with:
asdocx_update
Adding the pictures’ upload feature is a bit tricky. However, you can post asdocx output in html format. Follow these steps:
1. Use the save(myfile.html) option with asdocx to save the output in html
2. Open the output file with text editor and copy the contents starting fromclass ="asdocxtable"> upto the</div>. Paste it in the<pre></pre>tags.
3. You shall see a formatted tableIn the following example, I have copied the mentioned contents from myfile.html file and simply pasted it below.
sysuse auto, clear asdocx sum, replace save(myfile.html)
Descriptive StatisticsVariable Obs Mean Std. Dev. Min Max price 74 6165.257 2949.496 3291 15906 mpg 74 21.297 5.786 12 41 rep78 69 3.406 0.99 1 5 headroom 74 2.993 0.846 1.5 5 trunk 74 13.757 4.277 5 23 weight 74 3019.459 777.194 1760 4840 length 74 187.932 22.266 142 233 turn 74 39.649 4.399 31 51 displacement 74 197.297 91.837 79 425 gear_ratio 74 3.015 0.456 2.19 3.89 foreign 74 0.297 0.46 0 1 Notes: in reply to: Random Effects Parameters #17288I quickly checked the help file of
mixedand did not find any stored results for the random effects parameters. If this is the case, it is hard to report them using asdocx.in reply to: asdocx seems not to work after estimates use #17284I have added support for stored estimates now. Instead of using regress, use
replayto replay the stored estimates. Please update and try the following exampleasdocx_update
Example of detailed regression
sysuse auto.dta, clear
regress price mpg headroom trunk displacement
estimates save results, replace
clear
estimates use results
asdocx replay, replace save(detailed.html)
Linear regressionVariables Coef. Std. Err. t-value p-value [95% Co Interval] Sig mpg -124.512 75.153 -1.66 0.102 -274.438 25.414 headroom -789.532 471.188 -1.68 0.098 -1729.525 150.462 * trunk 66.222 106.529 0.62 0.536 -146.298 278.742 displacement 11.935 4.884 2.44 0.017 2.191 21.678 ** Constant 7914.615 2701.779 2.93 0.005 2524.713 13304.518 *** Mean dependent var SD dependent var . R-squared Number of obs 74.000 F-test Prob > F 0.000 Akaike crit. (AIC) Bayesian crit. (BIC) 1386.274 Notes: *** p<.01, ** p<.05, * p<.1 Example of nested regression
sysuse auto.dta, clear
regress price mpg headroom trunk displacement
estimates save results, replace
clear
estimates use results
asdocx replay, replace save(Nested.html) nest
Table: Regression results(1) Variables price mpg -124.512 (75.153) headroom -789.532* (471.188) trunk 66.222 (106.529) displacement 11.935** (4.884) Intercept 7914.615*** (2701.779) Observations 74 R2 0.303 Notes: Standard errors are in parentheses. *** p<.01, ** p<.05, * p<.1 in reply to: Export diagnostic plots with asdocx from Stata #17272Hello Johnathan
I have added the mentioned plots to asdocx. Please update asdocx.I have fixed the
svyandsemrelated issue, to update, typeasdocx_update, beta mlib
You may also like options
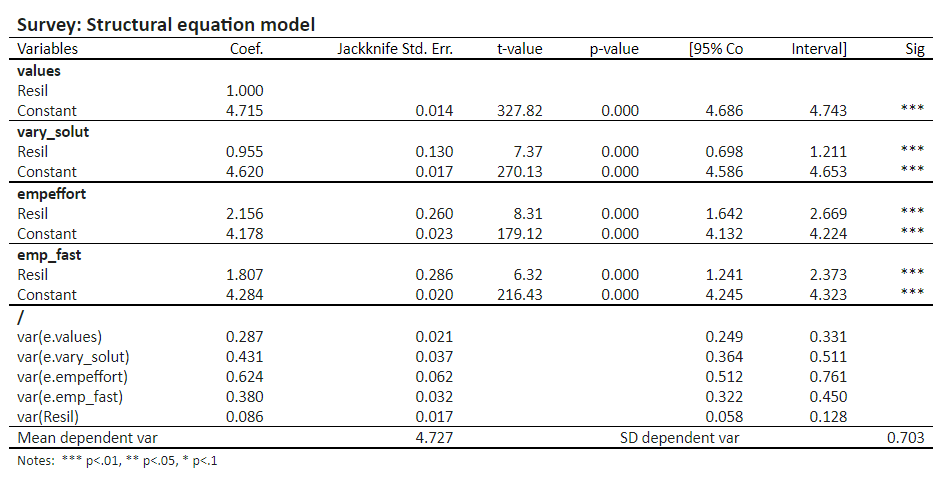
tzokandtable_layout(auto). The fist one reports equal number of decimal places for all values. The second one yields a tight fit for the table in the given page width.asdocx svy jackknife: sem (Resil->values, ) (Resil->vary_solut, ) /// (Resil->empeffort, )(Resil->emp_fast,), /// method(mlmv) latent (Resil) nocapslatent /// replace table_layout(auto) tzok
Thanks for reporting this. I have added the
lowesscommand to asdocx. The updates are still in beta version, therefore, to update, typeasdocx_update, beta mlib
Dear Dr Kumar
There is a major update to the table1 template. Now it can report any number of categories of the treatment variable. You may find more details on this page https://asdocx.com/documentations/creating-and-working-with-asdocx-template-files/table1-template-for-baseline-characteristics-of-patients-asdocx/#11 (on the given page, move to this section Multiple categories of the treatvar).Hello Jessica
asdocx license is machine-specific. The license works only on a PC/Mac for which the license was generated. The license is based on the information generated by theaslicprogram. Since, you have shifted to a new PC, you need a new license. As per FAQs, license works fine if you re-install your operating system or move to a new version of Stata. As a goodwill gesture, I shall create a new license for your new PC. Please installaslicand run it.net install aslic, from(http://fintechprofessor.com) aslic
It will generate few lines on the Stata screen, email those lines to me.
in reply to: save file in a specific location #17187Suhail Sayed
Thestcrprepis a community contributed package. I checked it and did not find any output after running it. Can you please elaborate what do you expect from including it to asdocx?in reply to: save file in a specific location #17183Wa Alaikum Assalam
Dear Suhail Sayed
Thanks for your appreciation and kind words. You can change the file name using the save() option. So, you want to save the results in a word file name Summary Statistics, an example would beasdocx sum, save(Summary Statistics.docx)
or in an excel file,
asdocx sum, save(Summary Statistics.xlsx)
You can also specify folder, say
paper1. (If the folder does not exist, asdocx will create it. Also, if you specify several nested folders, asdocx checks each one of them and create them if they do not exist)mkdir paper1 asdocx sum, save(paper1/summary statistics.docx) replace
in reply to: converting table to matrix after asdocx #17180Hello Jose
asdocx creates a string matrix in Mata. That matrix is available for modification and re-export using the flexmat package, that is part of asdocx. See this examplein reply to: Use asdocx in a loop for summary statistics #17038This is possible with flexmat. I encourage you to invest an hour or less on flexmat, and shall have the freedom to make sophisticated tables. Here is a starting blog post https://asdocx.com/flexmat-create-flexible-tables-in-stata-mata/. Let me show an example for creating your desired table.
 sysuse auto , clear
 loc NextRow 2
 flexmat reset
 flexmat addrow , data(Variable , Obs , Mean , Std. dev. , Min , Max) row(1)

 foreach var in price mpg trunk {
   sum `var' if `var' != 999
   flexmat addrow , data(`r(N)',`r(mean)',`r(sd)', `r(min)',`r(max)' ) row(`NextRow') dec(3)
   loc ++NextRow
  }
 asdocx export
Table: ResultsVariable Obs Mean Std. dev. Min Max price 74 6165.257 2949.496 3291 15906 mpg 74 21.297 5.786 12 41 trunk 74 13.757 4.277 5 23 Notes: -
AuthorPosts