
⠀ Introduction
In this post, I’ll demonstrate how to export the Spearman’s correlation table from Stata to various formats such as Word, Excel, LaTeX, or HTML. The spearman command in Stata is used to measure the strength and direction of association between two ranked variables. asdocx supports all the options of the official spearman command. Therefore, you can export observations, correlation coefficients, p-values, and significance stars for a given level.
⠀Syntax
[code]asdocx spearman [varlist] [if] [in] [, spearman_options] [asdocx_options][/code]
⠀asdocx options
You can use the following asdocx options with spearman:
| Option | Details |
|---|---|
| title(table title) | e.g., title(Table 2: Spearman Correlations) |
| notes(table notes) | notes(Data used from year 1999 to 2022) |
| dec(#) | Set decimal points, e.g., dec(4) |
| star(all) | Report stars at three levels of significance |
| setstars() | Define custom significance level for stars |
| save(file.docx) | Set file name and export to MS Word |
| save(file.xlsx) | Export to MS Excel |
| save(file.tex) | Export to LaTeX |
| save(file.html) | Export to HTML |
⠀ Setting custom significance level
The default configuration for reporting significance levels is set as follows:
[code]*** for p-values less than or equal to 0.01
** for p-values less than or equal to 0.05
* for p-values less than or equal to 0.1[/code]
However, the setstars option allows users to define their own levels for statistical significance.
⠀
⠀Syntax of setstars
The setstars option takes multiple arguments, each separated by a comma. Each argument consists of three components:
1. The symbol (e.g., *) that will be reported for the given significance level.
2. The @ sign that connects the significance level with the symbol.
3. The value at which the significance level is set.
For instance, if we want to report stars such that:
[code]*** for p-value 0.001 or less
** for p-value 0.01 or less
* for p-value 0.05 or less[/code]
We would write the setstars option as follows:
[code]setstars(*@.001, **@.01, ***@.05)[/code]
example:
[code]asdocx spearman mpg price rep78 trunk weight length , ///
pw star(all) replace setstars(*@.001, **@.01, ***@.05)[/code]
⠀
 Examples
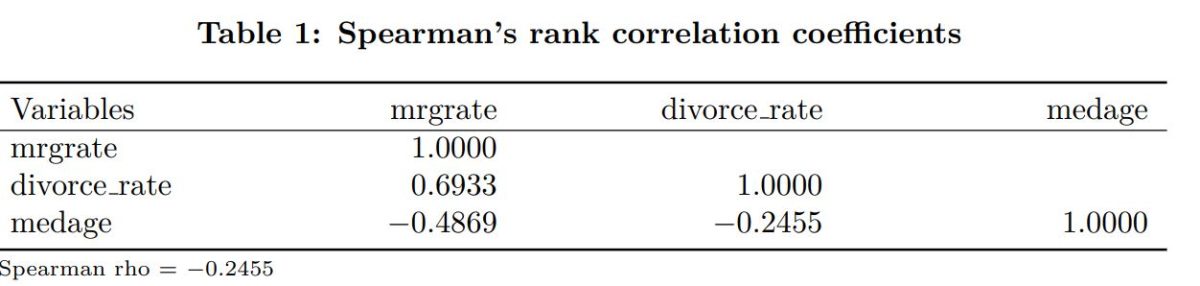
Spearman’s rank correlation coefficients; correlation coefficients are displayed by default.
[code] * Load example data
webuse states2
⠀
* Save in the output in MS Word file
asdocx spearman mrgrate divorce_rate medage, save(Spearman.docx) replace[/code]
⠀
Spearman’s rank correlation coefficients; correlation coefficients and p-values are displayed using the stats() option.
[code]spearman mrgrate divorce_rate medage, stats(rho p)[/code]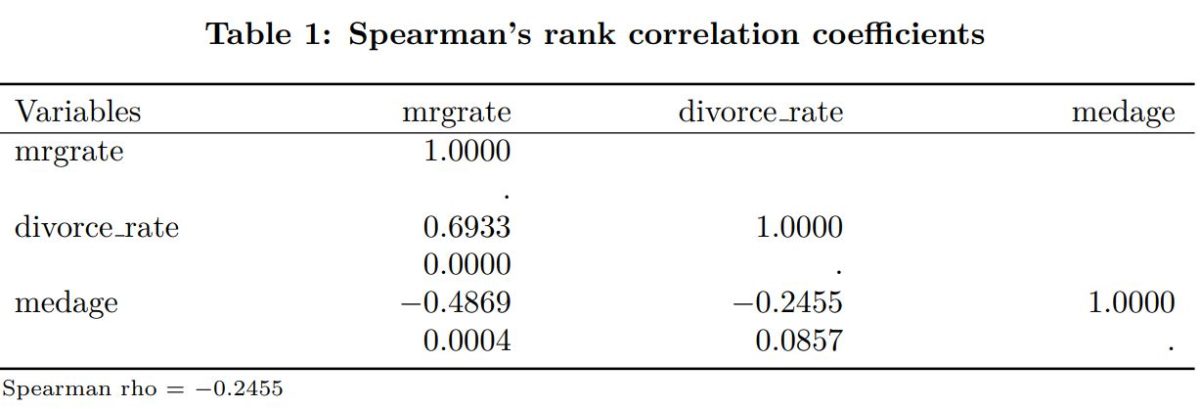
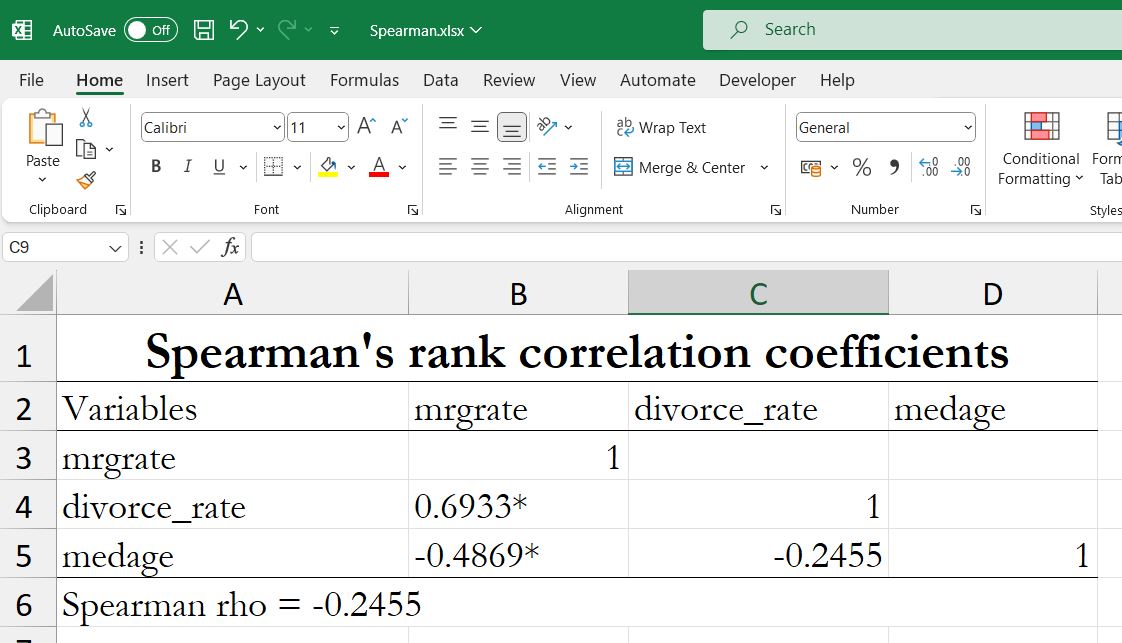
⠀Report stars
Star all correlation coefficients significant at the 5% level or lower. This time, let’s export the table to MS Excel.
[code]asdocx spearman mrgrate divorce_rate medage, save(Spearman.xlsx) star(.05) replace[/code]
 See also
- tabmany – Table of multiple coded answers
- tab3way – Three way table of frequencies and percentages
- mrtab – One- and two-way tables of multiple responses
- fre – One-way frequency tables
- missings – Various utilities for managing missing values
- tabulate, tab1, tab2
- pctab – Percentage over a grouping variable
 Order asdocx
Yearly license of asdocx is available at $9.99. Its life-time license is available at $49.99. With the asdocx membership, you get :
- Life-time license to use
- All future updates
- All premium templates / plugins.